

Projections for the Portuguese Economy
| 2024 | 2025F | 2026F | 2027F | 2028F | 2029F | |
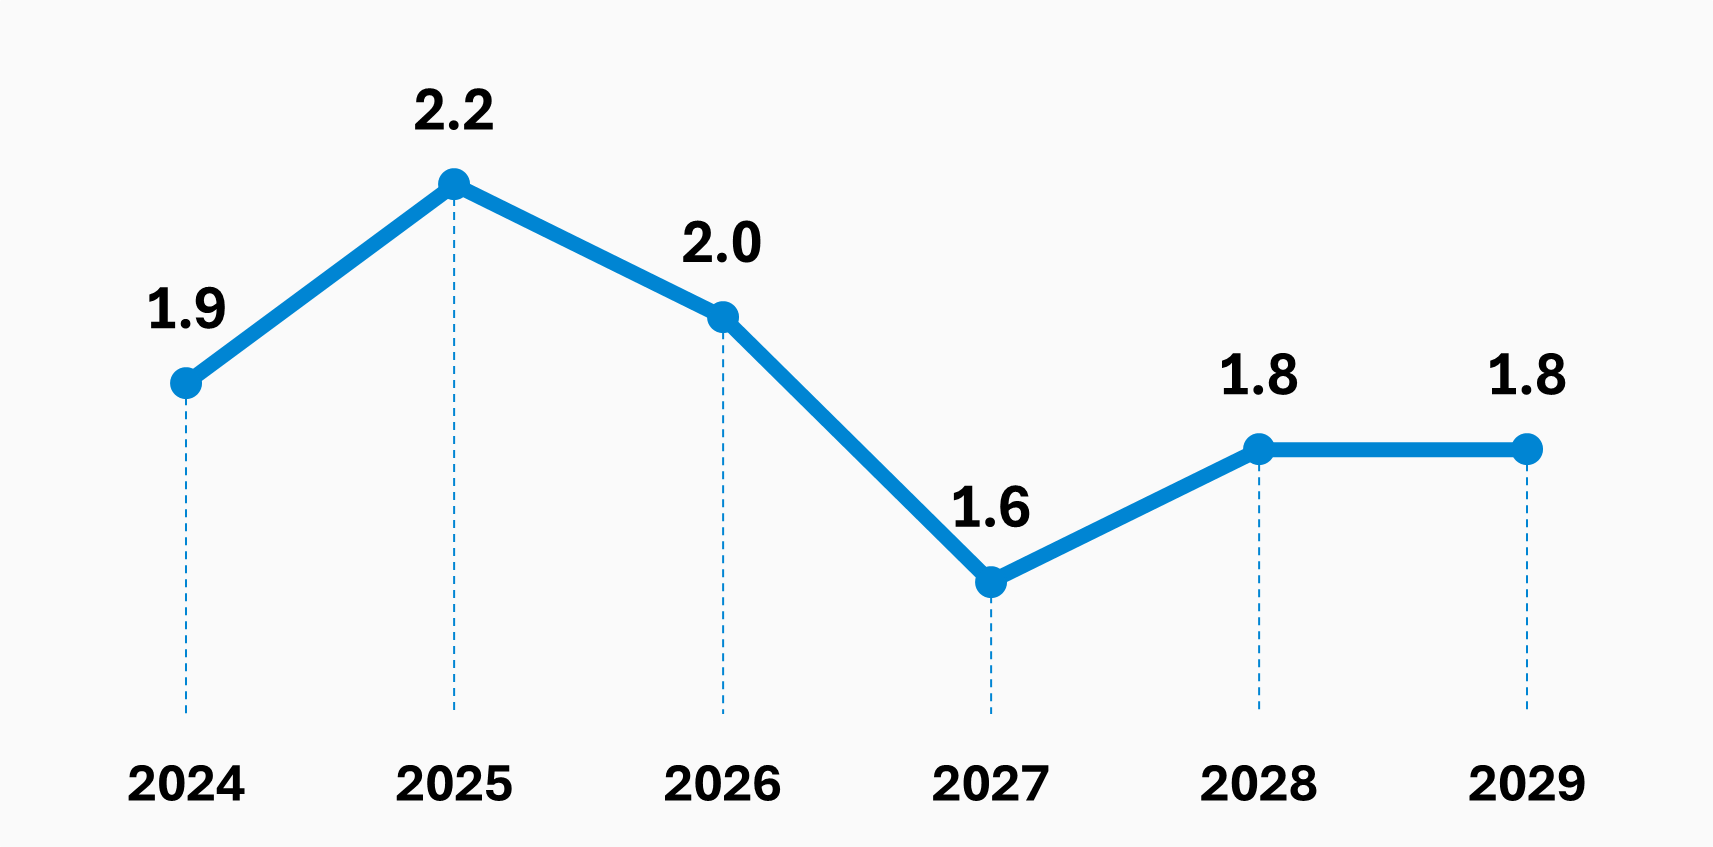
| Real GDP and components (change, %) | 1.9 | 2.2 | 2.0 | 1.6 | 1.8 | 1.8 |
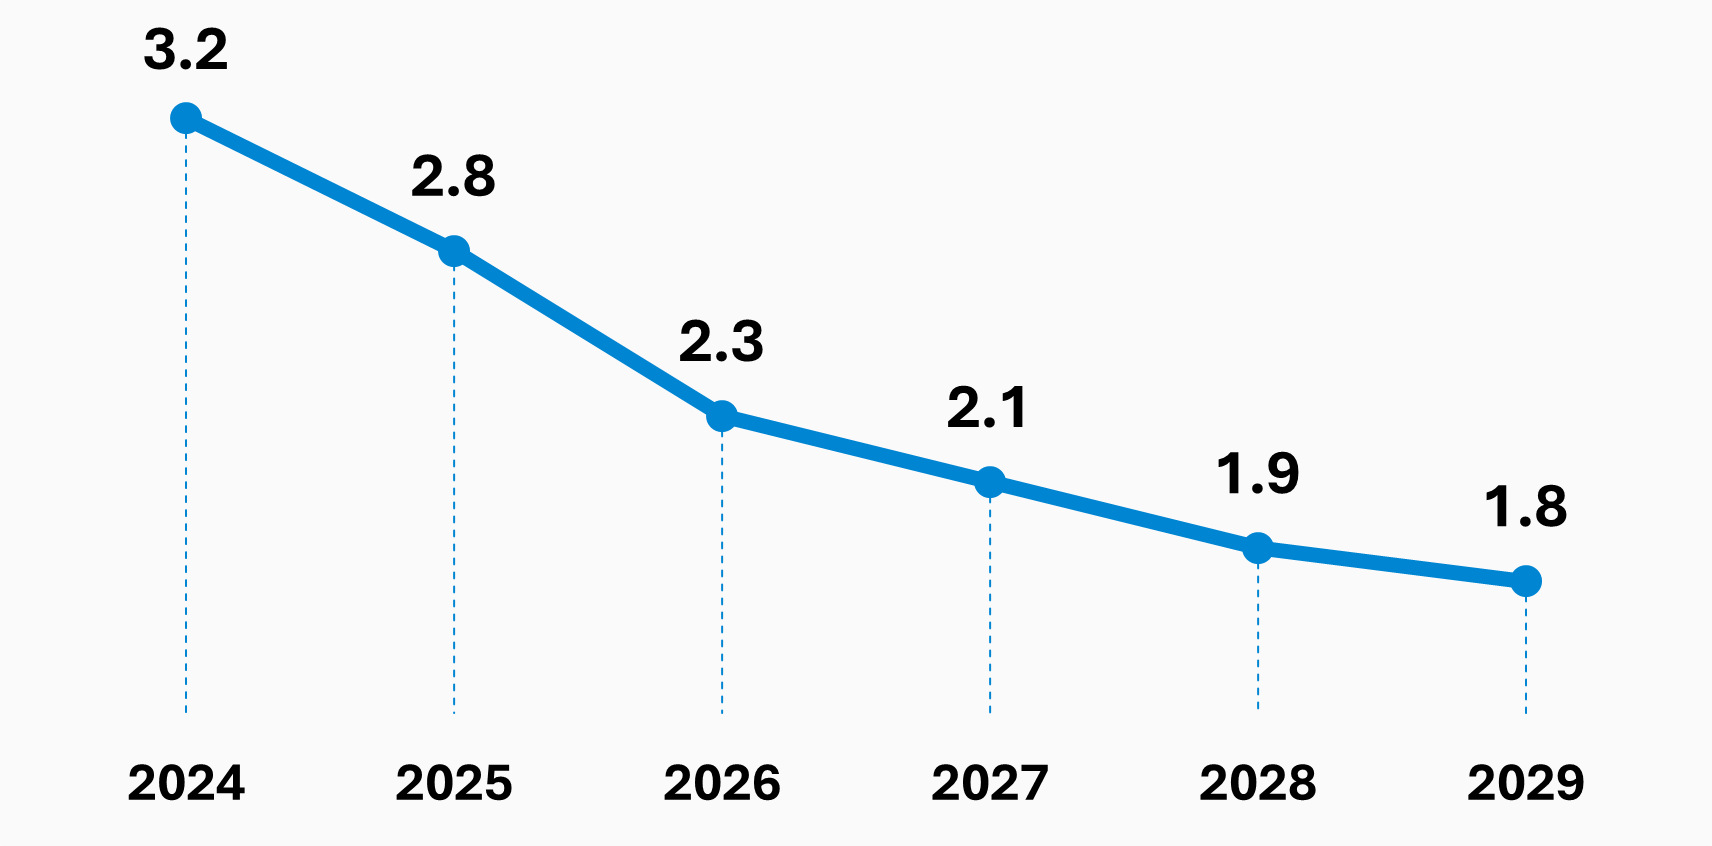
| Private Consumption | 3.2 | 2.8 | 2.3 | 2.1 | 1.9 | 1.8 |
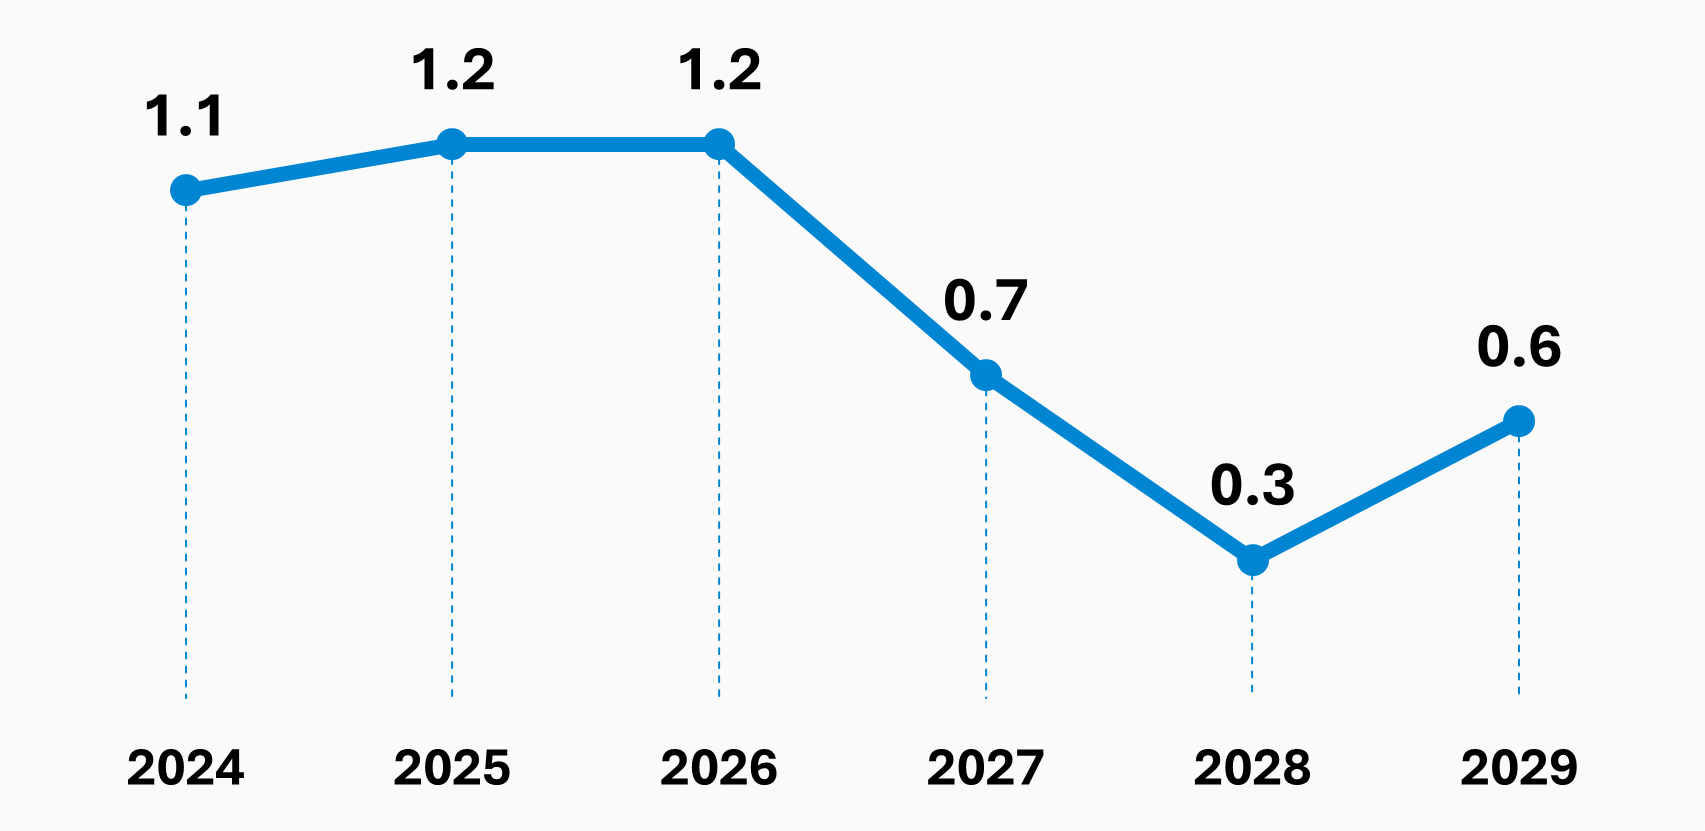
| Public Consumption | 1.1 | 1.2 | 1.2 | 0.7 | 0.3 | 0.6 |
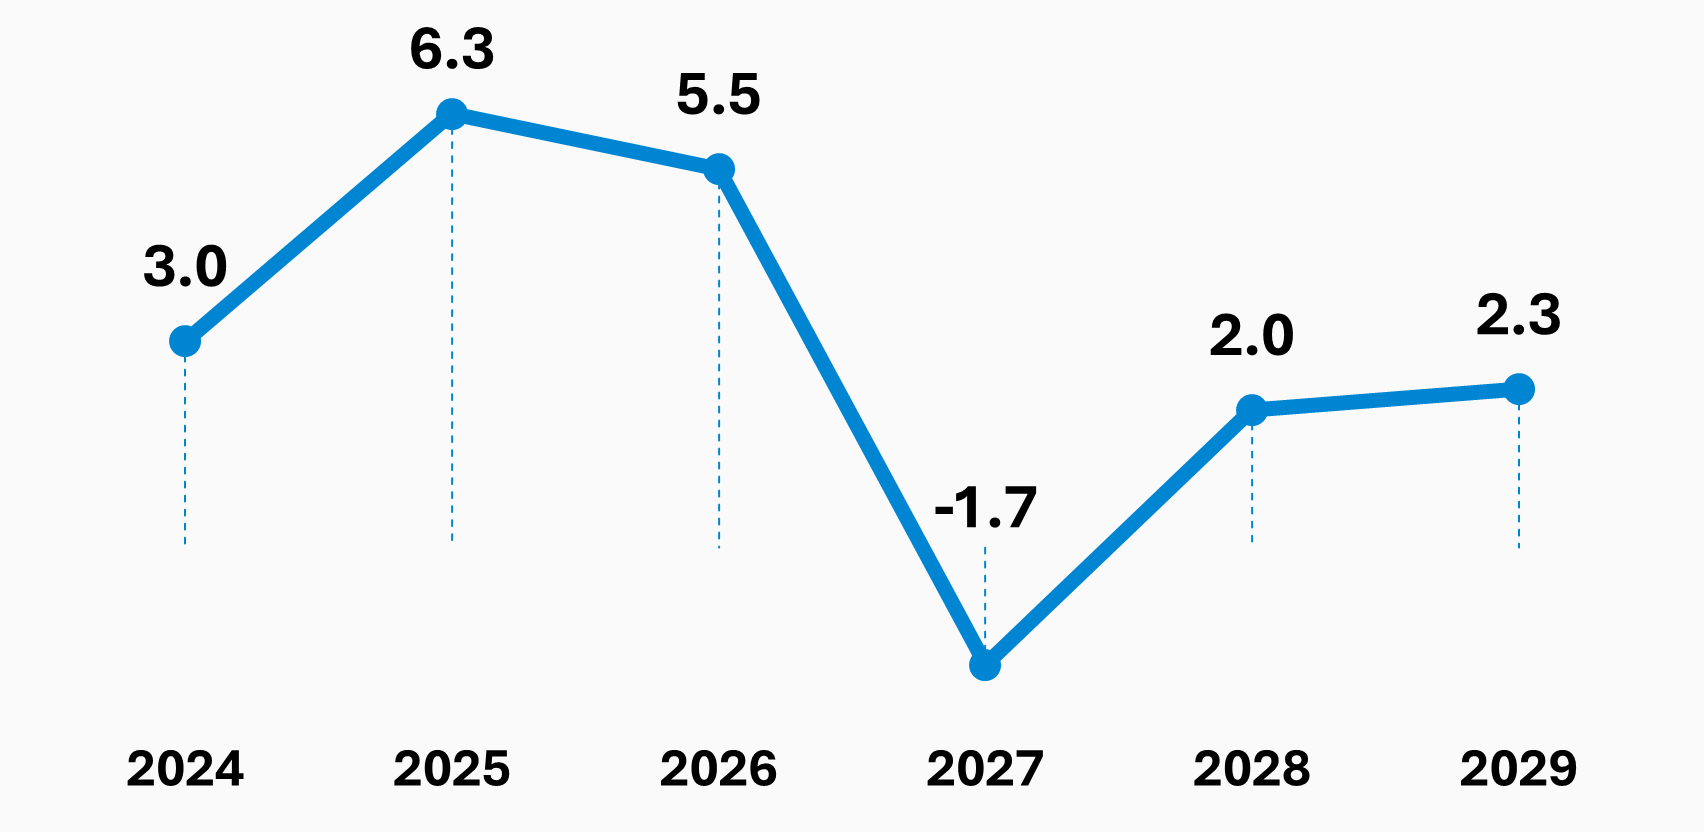
| Investment (GFCF) | 3.0 | 6.3 | 5.5 | -1.7 | 2.0 | 2.3 |
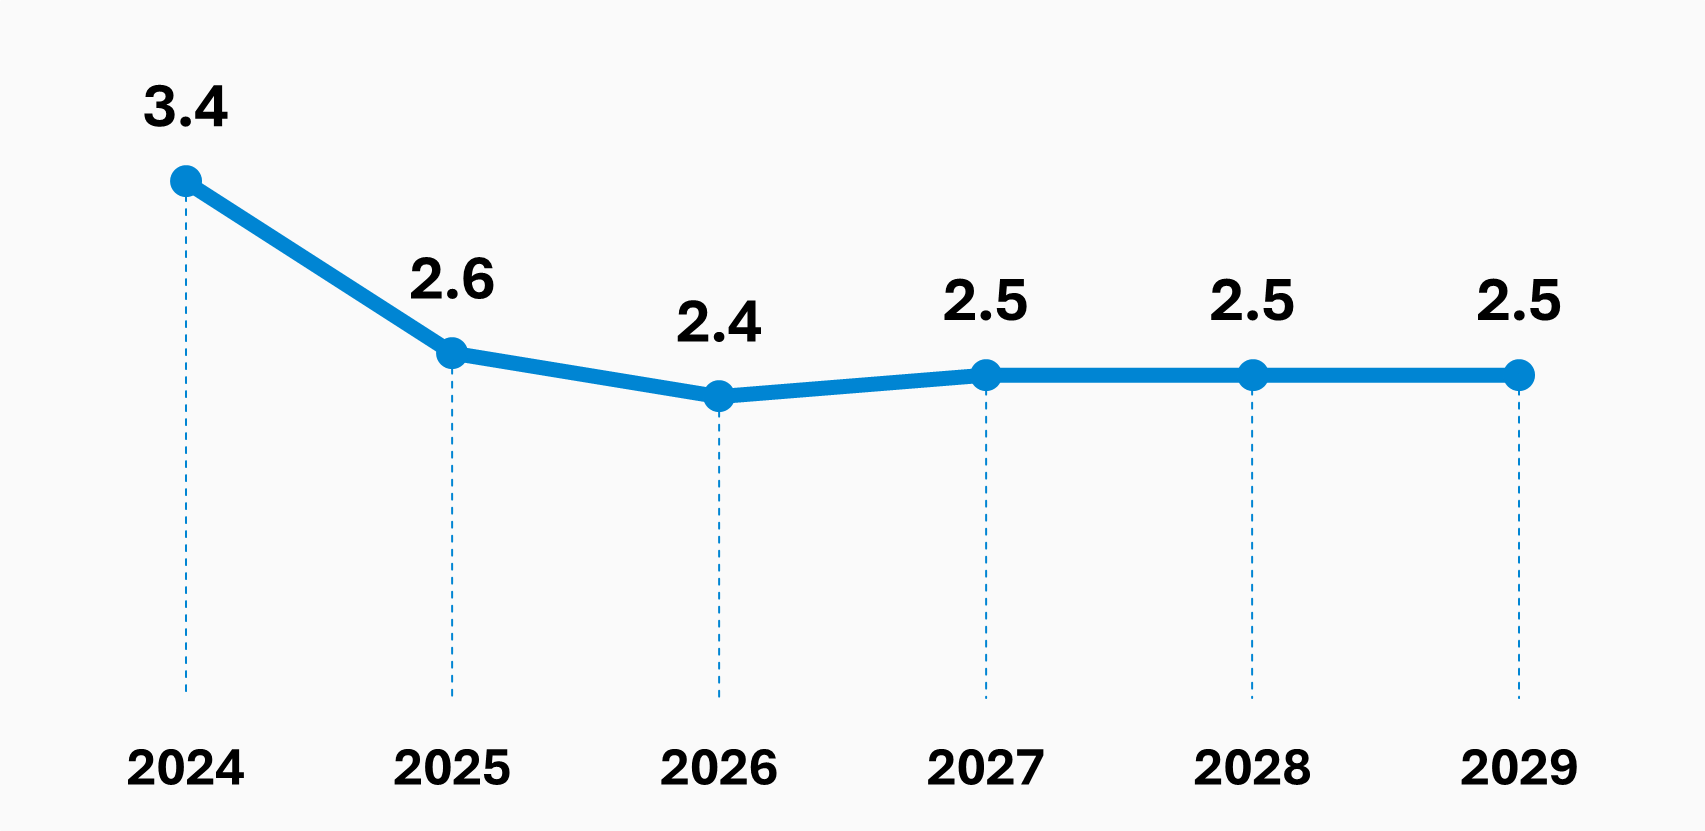
| Exports | 3.4 | 2.6 | 2.4 | 2.5 | 2.5 | 2.5 |
| Imports | 4.9 | 4.3 | 4.0 | 1.3 | 2.2 | 2.3 |
| Contributions (p.p.) | - | - | - | - | - | - |
| Domestic demand | 2.6 | 3.1 | 2.8 | 1.1 | 1.7 | 1.7 |
| Net exports | -0.7 | -0.8 | -0.8 | 0.5 | 0.1 | 0.1 |
| Prices (change, %) | - | - | - | - | - | - |
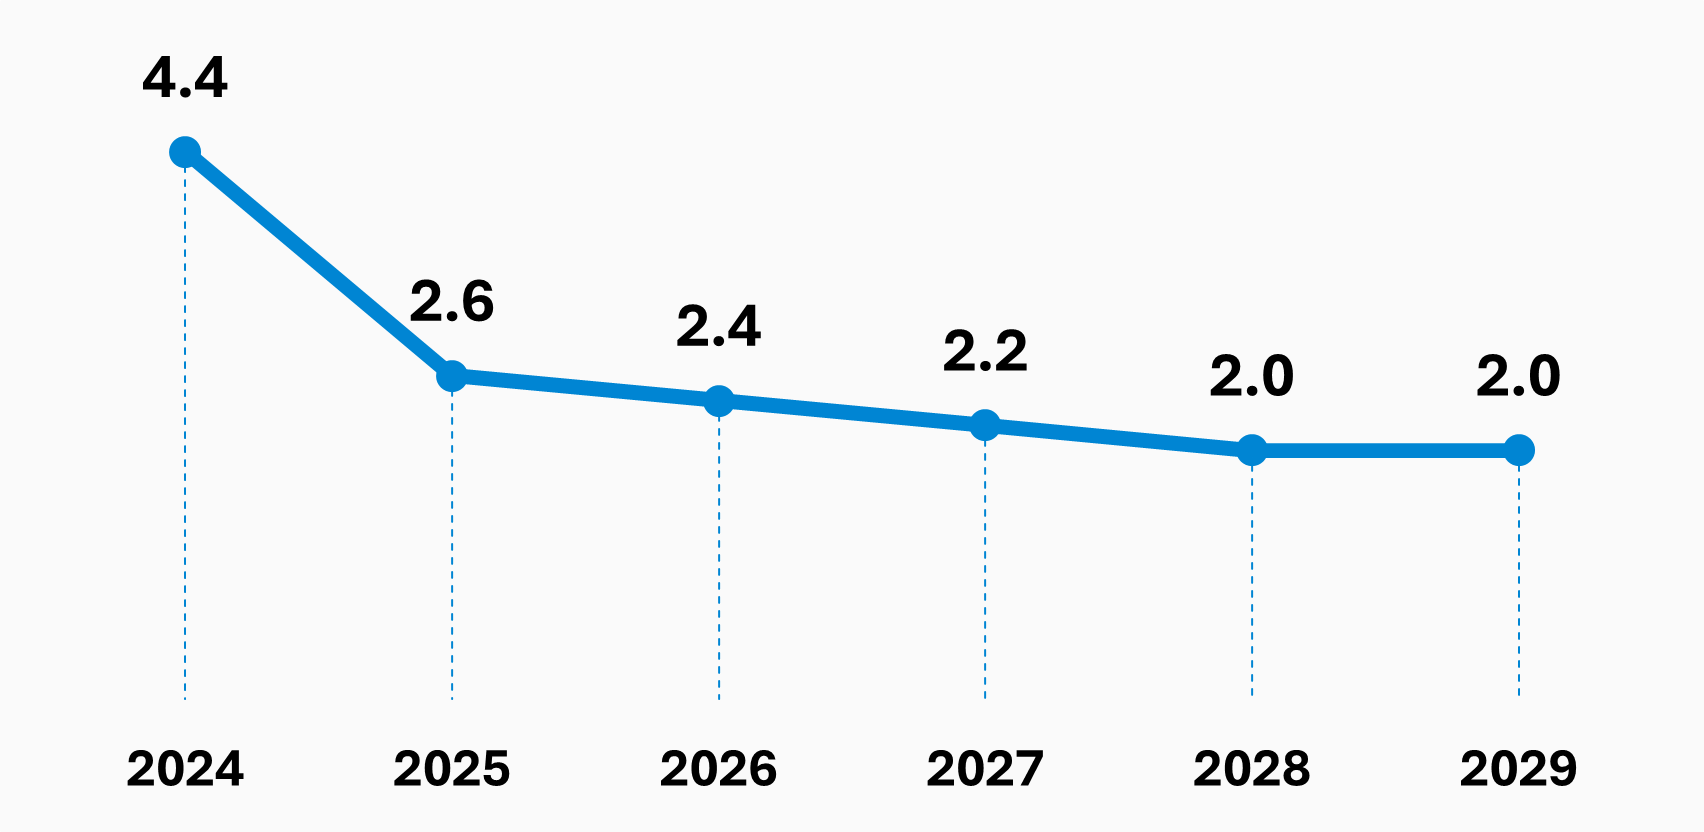
| GDP Deflator | 4.4 | 2.6 | 2.4 | 2.2 | 2.0 | 2.0 |
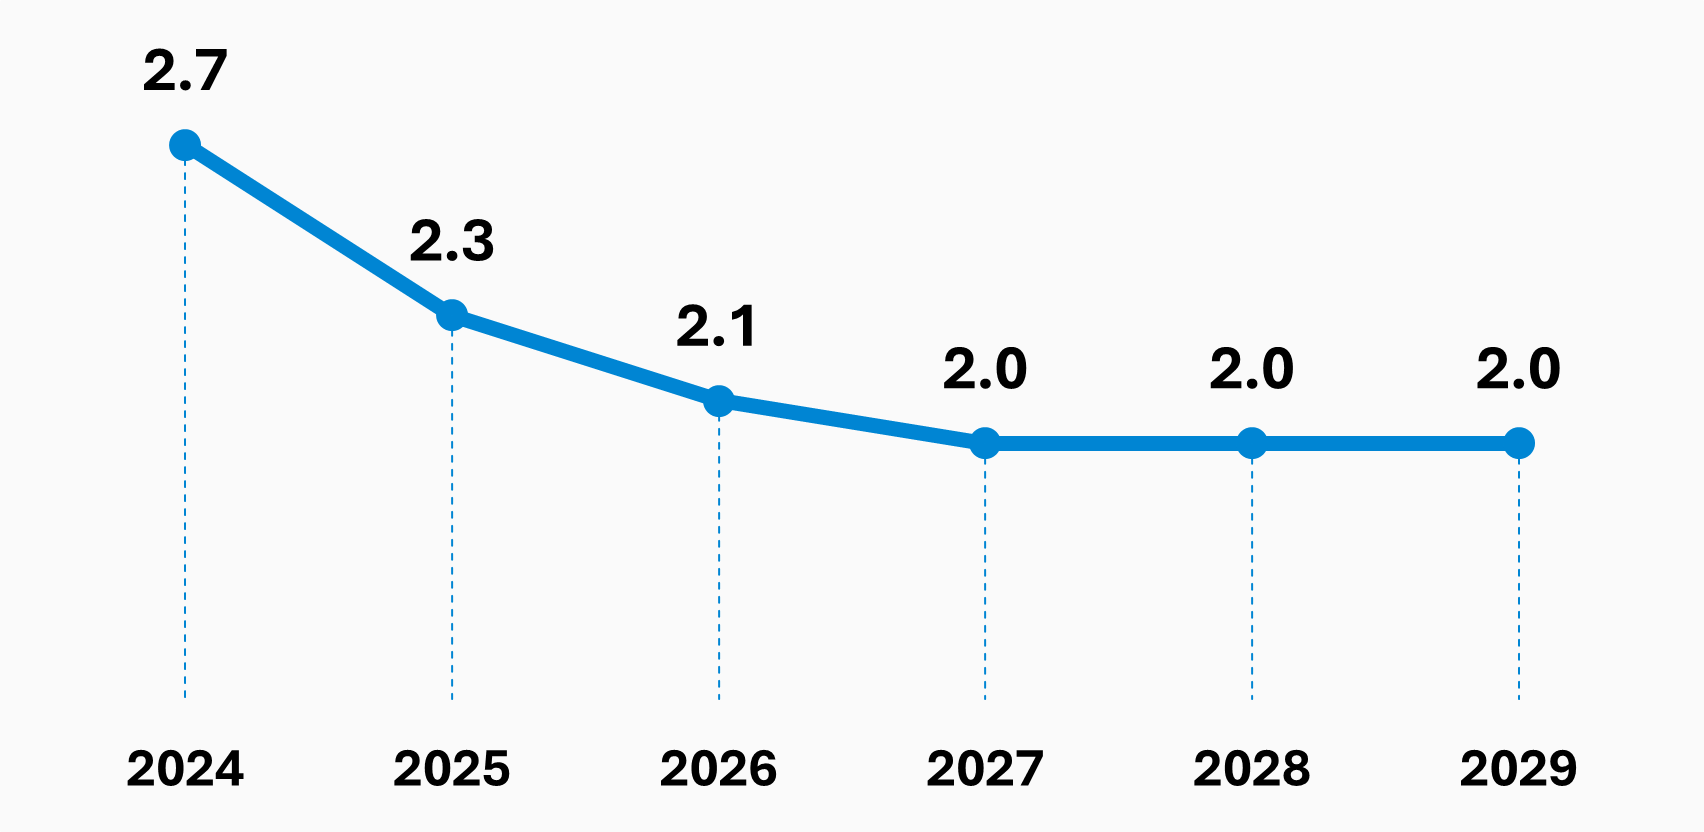
| HIPC | 2.7 | 2.3 | 2.1 | 2.0 | 2.0 | 2.0 |
| Labour Market (change, %) | - | - | - | - | - | - |
| Employment | 1.6 | 1.0 | 0.5 | 0.2 | 0.1 | 0.0 |
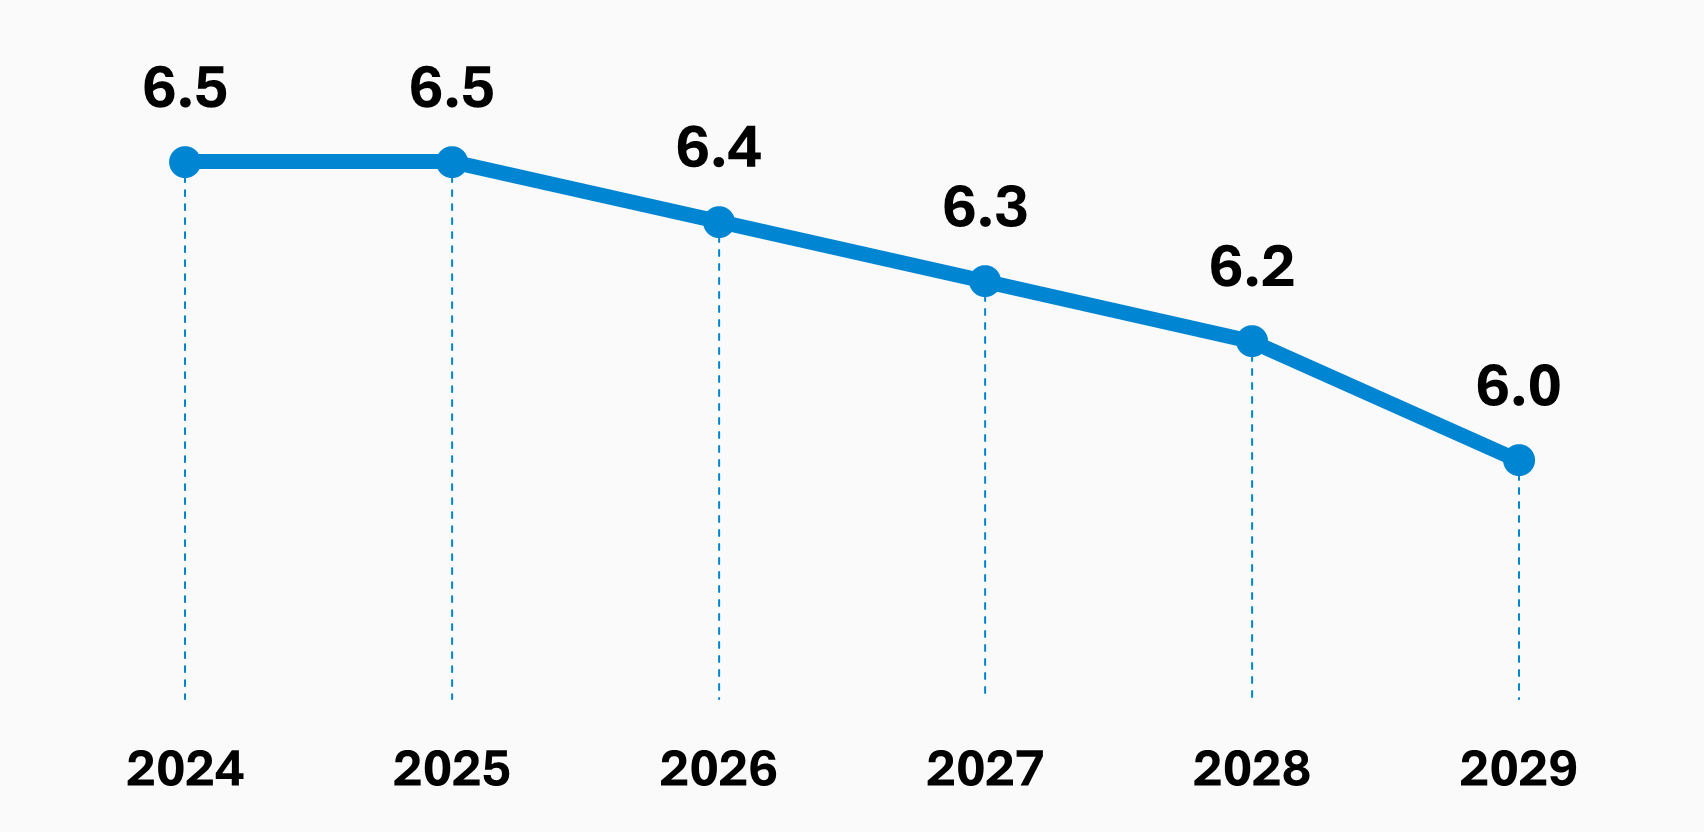
| Unemployment rate (%) | 6.5 | 6.5 | 6.4 | 6.3 | 6.2 | 6.0 |
| Apparent labour productivity | 0.3 | 1.2 | 1.5 | 1.5 | 1.6 | 1.7 |
| External sector (% GDP) | - | - | - | - | - | - |
| Net lending | 2.9 | 2.5 | 1.9 | 2.4 | 1.9 | 1.7 |
| Current account balance | 1.7 | 1.0 | 0.4 | 1.4 | 1.2 | 1.0 |
| Of which: balance of goods and services | 1.8 | 0.9 | 0.2 | 0.8 | 0.9 | 1.0 |
| Capital account balance | 1.1 | 1.5 | 1.4 | 1.0 | 0.7 | 0.6 |
National accounts perspective – 2021 Basis; F – Forecast
Sources: 2024 – INE, I.P. and BdP; 2025-2029 – Conselho das Finanças Públicas
Source: INE, I.P. e Ministério das Finanças
"*" indicates required fields


"*" indicates required fields
"*" indicates required fields