Greater Lisbon

970
42 221
RevPAR (millions of €)
106.8
Room occupancy rate (%)
72.9
Room income (millions of €)
1 629.4
Revenue from accommodation (millions of euros)
2 012.6
Overnight stays (thousand)
19 444.0
Guests (thousand)
8 502.3
Average stay (No. of nights)
2.3
North

2 219
42 313
RevPAR (millions of €)
56.4
Room occupancy rate (%)
63.0
Room income (millions of €)
830
Revenue from accommodation (millions of euros)
1 059.9
Overnight stays (thousand)
14 103.9
Guests (thousand)
7 420.0
Average stay (No. of nights)
1.9
Centre

1 140
20 643
RevPAR (millions of €)
32.8
Occupancy rate (%)
49.3
Room income (millions of €)
237.8
Revenue from accommodation (millions of euros)
317.4
Overnight stays (thousand)
5 162.8
Guests (thousand)
2 962.7
Average stay (No. of nights)
1.7
Alentejo

822
12 748
RevPAR (millions of €)
48,7
Room occupancy rate (%)
58,1
Room income (millions of €)
208.4
Revenue from accommodation (millions of euros)
277.4
Overnight stays (thousand)
3 254.2
Guests (thousand)
1 692.9
Average stay (No. of nights)
1.9
Algarve

1 169
53 359
RevPAR (millions of €)
74.4
Room occupancy rate (%)
69.4
Room income (millions of €)
1 267.7
Revenue from accommodation (millions of euros).
1 699.7
Overnight stays (thousand)
20 754.8
Guests (thousand)
5 255.9
Average stay (No. of nights)
3.9
Autonomous Region of Madeira

484
17 992
RevPAR (millions of €)
83.1
Room occupancy rate (%)
80.0
Room income (millions of €)
537.9
Revenue from accommodation (millions of euros)
757.3
Overnight stays (thousand)
9 514.3
Guests (thousand)
2 058.5
Average stay (No. of nights)
4.6
Autonomous Region of the Azores

589
8 716
RevPAR (millions of €)
62.7
Room occupancy rate (%)
64.8
Room income (millions of €)
182.6
Revenue from accommodation (millions of euros)
228.6
Overnight stays (thousand)
2 996.3
Guests (thousand)
1 000.7
Guests (thousand)
3.0
West and Tagus Valley

584
13 131
RevPAR (millions of €)
34
Room occupancy rate (%)
48.6
Room income (millions of €)
154.6
Revenue from accommodation (millions of euros)
214.2
Overnight stays (thousand)
3 493.5
Guests (thousand)
1 925.4
Average stay (No. of nights)
1.8
Setubal Peninsula

162
4 146
RevPAR (millions of €)
53.7
Room occupancy rate (%)
69.1
Room income (millions of €)
79.4
Revenue from accommodation (millions of euros)
102.4
Overnight stays (thousand)
1 566.8
Guests (thousand)
770.9
Average stay (No. of nights)
2
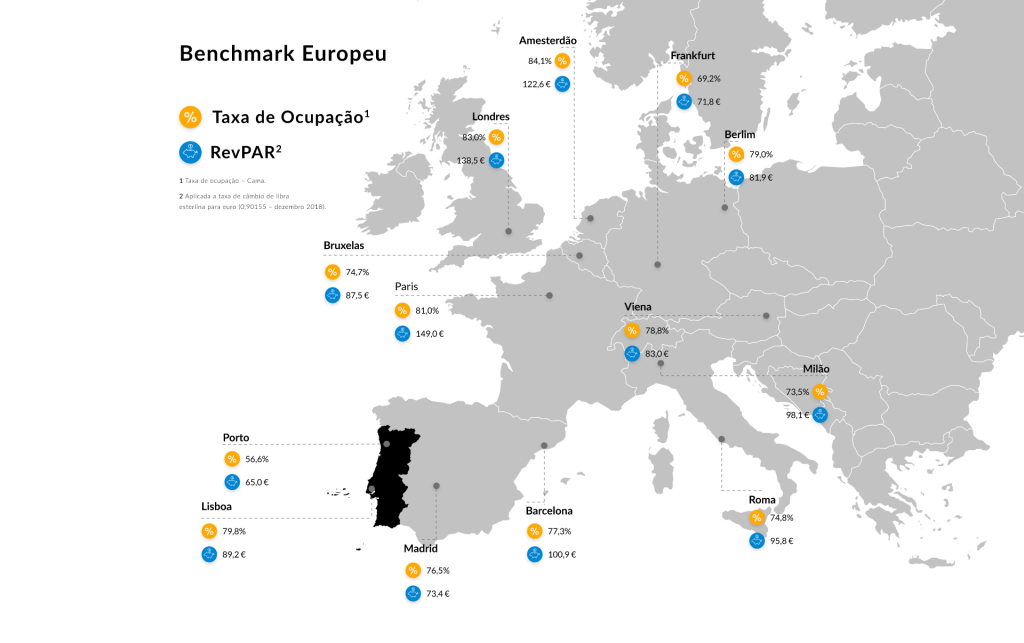
Source: TravelBI
North
Centre
M. A. Lisbon
Alentejo
Algarve
A. R. Azores
A. R. Madeira