Tourism
The competitiveness of the regions
You are here:
- Home
- Portugal at a glance
- Regional Analysis
Regional analysis
2024
Select a region on the map
Greater Lisbon
970
11.9%
42 221
19.6%
RevPAR (millions of €)
106.8
Room occupancy rate (%)
72.9
Room income (millions of €)
1 629.4
Revenue from accommodation (millions of euros)
2 012.6
Overnight stays (thousand)
19 444.0
Guests (thousand)
8 502.3
Average stay (No. of nights)
2.3
North

2 219
27.3%
42 313
19.7%
RevPAR (millions of €)
56.4
Room occupancy rate (%)
63.0
Room income (millions of €)
830
Revenue from accommodation (millions of euros)
1 059.9
Overnight stays (thousand)
14 103.9
Guests (thousand)
7 420.0
Average stay (No. of nights)
1.9
Centre

1 140
14%
20 643
9.6%
RevPAR (millions of €)
32.8
Occupancy rate (%)
49.3
Room income (millions of €)
237.8
Revenue from accommodation (millions of euros)
317.4
Overnight stays (thousand)
5 162.8
Guests (thousand)
2 962.7
Average stay (No. of nights)
1.7
Alentejo
822
10.1%
12 748
5.9%
RevPAR (millions of €)
48,7
Room occupancy rate (%)
58,1
Room income (millions of €)
208.4
Revenue from accommodation (millions of euros)
277.4
Overnight stays (thousand)
3 254.2
Guests (thousand)
1 692.9
Average stay (No. of nights)
1.9
Algarve

1 169
14.4%
53 359
24.8%
RevPAR (millions of €)
74.4
Room occupancy rate (%)
69.4
Room income (millions of €)
1 267.7
Revenue from accommodation (millions of euros).
1 699.7
Overnight stays (thousand)
20 754.8
Guests (thousand)
5 255.9
Average stay (No. of nights)
3.9
Autonomous Region of Madeira
484
5.9%
17 992
8.4%
RevPAR (millions of €)
83.1
Room occupancy rate (%)
80.0
Room income (millions of €)
537.9
Revenue from accommodation (millions of euros)
757.3
Overnight stays (thousand)
9 514.3
Guests (thousand)
2 058.5
Average stay (No. of nights)
4.6
Autonomous Region of the Azores

589
7.2%
8 716
4%
RevPAR (millions of €)
62.7
Room occupancy rate (%)
64.8
Room income (millions of €)
182.6
Revenue from accommodation (millions of euros)
228.6
Overnight stays (thousand)
2 996.3
Guests (thousand)
1 000.7
Guests (thousand)
3.0
West and Tagus Valley
584
7.2%
13 131
6.1%
RevPAR (millions of €)
34
Room occupancy rate (%)
48.6
Room income (millions of €)
154.6
Revenue from accommodation (millions of euros)
214.2
Overnight stays (thousand)
3 493.5
Guests (thousand)
1 925.4
Average stay (No. of nights)
1.8
Setubal Peninsula
162
2%
4 146
1.9%
RevPAR (millions of €)
53.7
Room occupancy rate (%)
69.1
Room income (millions of €)
79.4
Revenue from accommodation (millions of euros)
102.4
Overnight stays (thousand)
1 566.8
Guests (thousand)
770.9
Average stay (No. of nights)
2
Source: TravelBI
Seasonality
2019
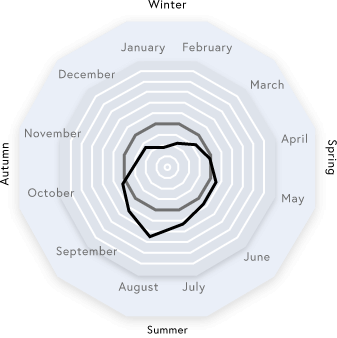
North
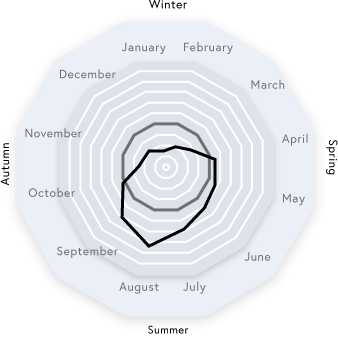
Centre
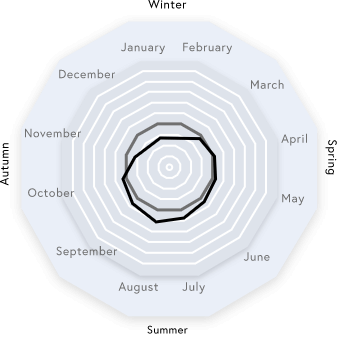
M. A. Lisbon
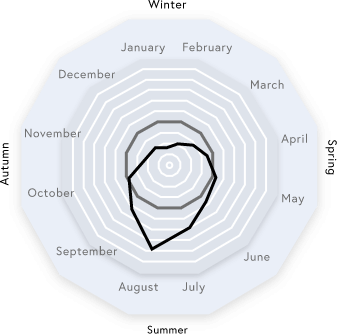
Alentejo
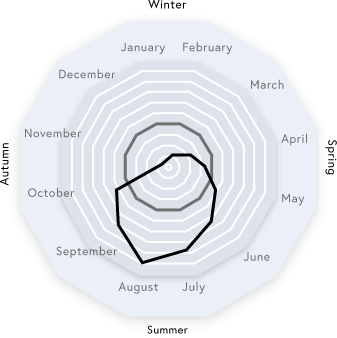
Algarve
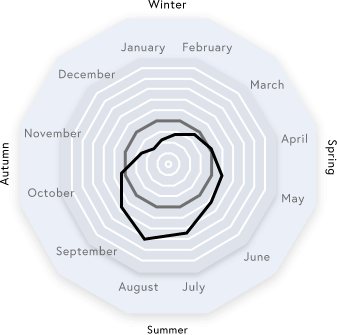
A. R. Azores
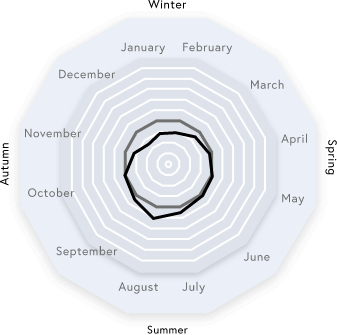
A. R. Madeira
Source: TravelBI and INE, I.P
Análise Comparativa
2019
| A. M. Lisboa (Região) | Lisboa (Cidade) | Norte (Região) | Porto (Cidade) | |
| RevPAR (€) | 73,7 | 80,55 | 42,9 | 66,51 |
| Taxa de ocupação (%) | 56,8 | 59,7 | 42,6 | 55,1 |
| Capacidade de alojamento (N.º de quartos) | 41 159 | 29 306 | 33 685 | 10 272 |
| Proveitos de aposento (milhares de €) | 1 083 690 | 851 171 | 497 124 | 243 871 |
| Dormidas | 18 639 062 | 13 985 262 | 10 810 712 | 4 587 237 |
| Hóspedes | 8 216 681 | 5 980 014 | 5 873 026 | 2 245 291 |
| Estada média (N.º de noites) | 2,3 | 2,3 | 1,8 | 2,0 |
Fonte: INE, I.P.
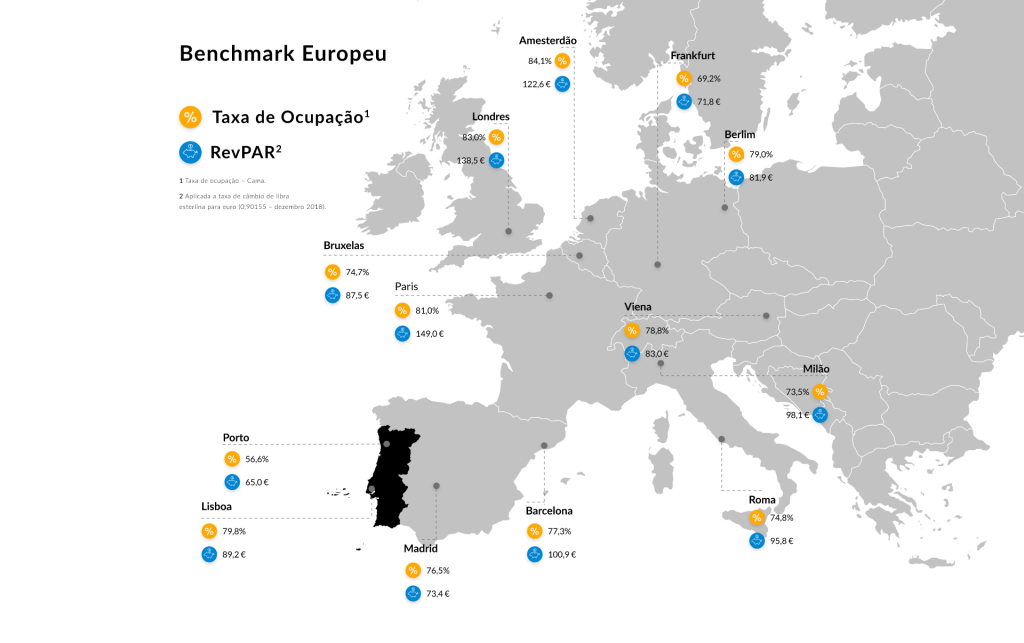
Fonte: Deloitte, Portuguese Hospitality Atlas 2019

